0%

你好,这里是拼图收集者。

这个博客会记录一些和技术相关的内容,主要包括:

  • Linux
  • Golang
  • Lua
  • Python
  • Node.js
  • Kubernetes
  • Redis

先把站搭起来,后面再慢慢填坑。

方法一

top -P pid,其中RSS为进程当前使用的内存

1
2
3
4
5
6
7
8
top - 22:18:50 up 163 days,  5:48, 64 users,  load average: 0.88, 1.07, 1.45
Tasks: 1 total, 0 running, 1 sleeping, 0 stopped, 0 zombie
%Cpu(s): 1.5 us, 0.9 sy, 0.0 ni, 97.3 id, 0.0 wa, 0.0 hi, 0.0 si, 0.3 st
KiB Mem : 32950160 total, 3186404 free, 19244656 used, 10519100 buff/cache
KiB Swap: 2097148 total, 1736340 free, 360808 used. 12881604 avail Mem

PID USER PR NI VIRT RES SHR S %CPU %MEM TIME+ COMMAND
1696650 banfush+ 20 0 712796 100940 29096 S 11.3 0.3 7659:06 node

方法二

cat /proc/pid/status其中VMRSS为进程使用内存

1
2
3
4
5
6
7
8
9
10
11
12
13
14
15
16
17
18
19
20
21
22
23
24
25
26
27
28
29
30
31
32
33
34
35
banfushen@ma100:~/$ cat /proc/1696650/status
Name: node
Umask: 0022
State: S (sleeping)
Tgid: 1696650
Ngid: 0
Pid: 1696650
PPid: 1696531
TracerPid: 0
Uid: 50301 50301 50301 50301
Gid: 50301 50301 50301 50301
FDSize: 128
Groups: 0 4 999 50301
NStgid: 1696650
NSpid: 1696650
NSpgid: 245413
NSsid: 245413
VmPeak: 715100 kB
VmSize: 712796 kB
VmLck: 0 kB
VmPin: 0 kB
VmHWM: 121080 kB
VmRSS: 100444 kB
RssAnon: 71348 kB
RssFile: 29096 kB
RssShmem: 0 kB
VmData: 148608 kB
VmStk: 132 kB
VmExe: 63804 kB
VmLib: 5308 kB
VmPTE: 1300 kB
VmPMD: 1076 kB
VmSwap: 0 kB
HugetlbPages: 0 kB
...

Ubuntu 18.04.3 安装redis,配置端口与密码

下载

sudo apt-get install redis-server

查看

ps -aux | grep redis

修改端口

sudo subl /etc/redis/redis.conf,改为自己想要的端口。
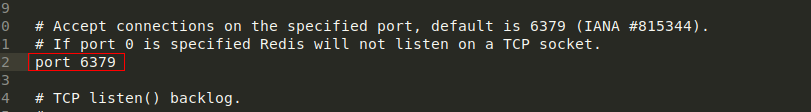
重启redis

sudo service redis-server restart
ps -aux | grep redis

密码修改

继续修改/etc/redis/redis.conf,找到一个 # requirepass foobared 的字段将这个字段的注释取消掉,这个字段是数据的访问密码,将foobared替换成自己想要设置的密码。

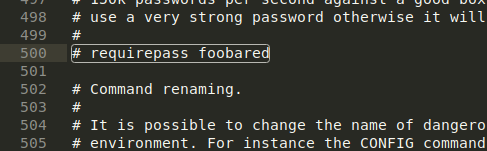
修改后重启redis,sudo service redis-server restart

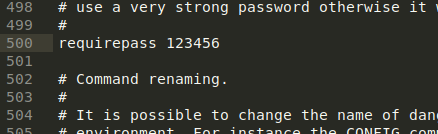
sbul是我装了sublime text之后的编辑器,如果没有安装,将subl换成vi/vim即可。我自己通过以上方式,已能修改,做次记录。

2022.5.4

计划将csnd的博客全部搬到github

背景知识

Perf是用于软件性能分析的工具,通过Perf,应用程序可以利用PMU,tracepoint和内核中的特殊计数器进行性能统计。Perf不但可以分析应用程序的性能问题(per thread),也可以分析内核的性能问题,处理所有性能相关的事件:程序运行期间的硬件事件,如instructions retired ,processor clock cycles等;软件事件,如Page Fault和进程切换。

Perf基本原理是对被监测对象进行采样,最简单的情形是根据tick中断进行采样,即在tick中断内触发采样点,在采样点里判断程序当前的上下文。假如一个程序90%的时间都花费在函数func1()上,那么90%的采样点都应该落在函数func1()的上下文中,采样时间越长,上述推论越可靠。使用perf要有管理员权限

使用perf对多线程进行profile

准备多线程程序

在此程序中,创建了两个线程。分别跑了不同次数的func1()方法。gcc -lpthread main.c

1
2
3
4
5
6
7
8
9
10
11
12
13
14
15
16
17
18
19
20
21
22
23
24
25
26
27
28
29
30
31
32
33
34
35
36
37
38
39
40
41
42
43
44
45
46
47
48
49
50
51
52
53
54
55
56
57
58
59
60
61
62
63
64
65
#include <pthread.h>
#include <stdio.h>
#include <string.h>

pthread_t thread[2];

void func1() {
int i = 0;
while (i<10000)
++i;
}

void func2() {
int i = 0;

while (i<10000)
i = i*2;
func1();
}

void *thread1()
{
for (;;)
{
func1();
}

pthread_exit(NULL);
}

void *thread2()
{
for (;;)
{
func2();
}

pthread_exit(NULL);
}

void thread_create(void)
{
int temp;
memset(&thread, 0, sizeof(thread));
if((temp = pthread_create(&thread[0], NULL, thread1, NULL)) != 0)
printf("线程1创建失败!\n");
else
printf("线程1被创建\n");

if((temp = pthread_create(&thread[1], NULL, thread2, NULL)) != 0)
printf("线程2创建失败\n");
else
printf("线程2被创建\n");
}

int main()
{
thread_create();
pthread_join(thread[0],NULL);
printf("线程1加入");
pthread_join(thread[1],NULL);
printf("线程2加入");

return 0;
}

使用perf对程序进行采样

对还没启动的程序

1
2
3
4
5
6
7
8
9
10
root@ma100:/home/banfushen/perf_cpu/multi_thread# perf record -h
Usage: perf record [<options>] [<command>]
or: perf record [<options>] -- <command> [<options>]

...
-F, --freq <n> profile at this frequency
-g enables call-graph recording
-p, --pid <pid> record events on existing process id
-t, --tid <tid> record events on existing thread id
...

perf record -g -F 99 ./a.out,对多线程程序进行采样,采样频率99,(-F 99: sample at 99 Hertz (samples per second). I’ll sometimes sample faster than this (up to 999 Hertz), but that also costs overhead. 99 Hertz should be negligible. Also, the value ‘99’ and not ‘100’ is to avoid lockstep sampling, which can produce skewed results.)。运行完毕会得到一个perf.data,要想得到火焰图,还需要借助别的工具。

对已经启动的程序

对于已经启动的程序,要拿到pid,perf record -g -F 99 -p <pid>

下载工具FlameGraph

git clone https://github.com/brendangregg/FlameGraph.git

1
2
banfushen@ma100:~/perf_cpu/FlameGraph$ pwd
/home/banfushen/perf_cpu/FlameGraph

生成火焰图

对perf.data生成火焰图(按照上面来说就是一个进程的)

perf script |/home/banfushen/perf_cpu/FlameGraph/stackcollapse-perf.pl|/home/banfushen/perf_cpu/FlameGraph/flamegraph.pl > output.svg
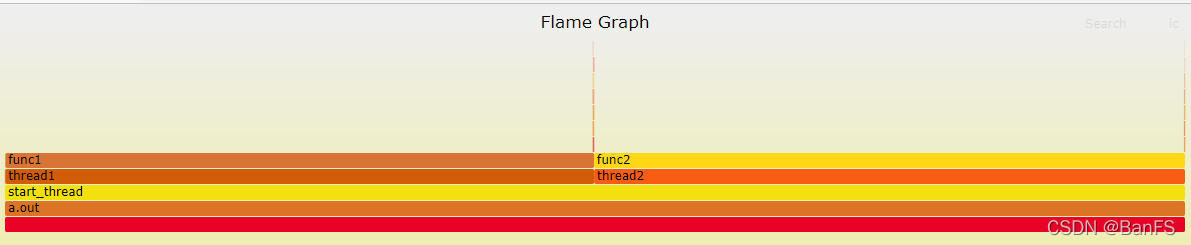
对单个线程生成火焰图

要知道线程id

1
2
3
4
5
6
7
8
9
10
11
12
13
root@ma100:/home/banfushen/perf_cpu/multi_thread# perf script -h

Usage: perf script [<options>]
or: perf script [<options>] record <script> [<record-options>] <command>
or: perf script [<options>] report <script> [script-args]
or: perf script [<options>] <script> [<record-options>] <command>
or: perf script [<options>] <top-script> [script-args]

...
-v, --verbose be more verbose (show symbol address, etc)
--pid <pid[,pid...]>
--tid <tid[,tid...]>
only consider symbols in these tids

perf script -v --tid <tid> 指定线程
perf script -v --tid 2283471|/home/banfushen/perf_cpu/FlameGraph/stackcollapse-perf.pl|/home/banfushen/perf_cpu/FlameGraph/flamegraph.pl > output1.svg

对多个线程生成火焰图

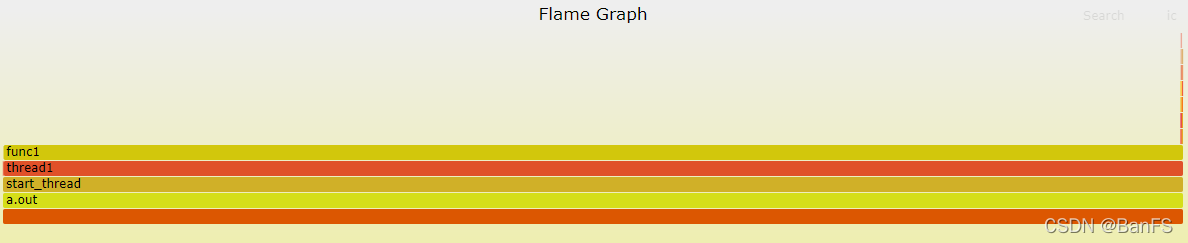
perf script -v --tid <tid[,tid...]> 指定多个线程
perf script -v --tid 2283472,2283471|/home/banfushen/perf_cpu/FlameGraph/stackcollapse-perf.pl|/home/banfushen/perf_cpu/FlameGraph/flamegraph.pl > output3.svg
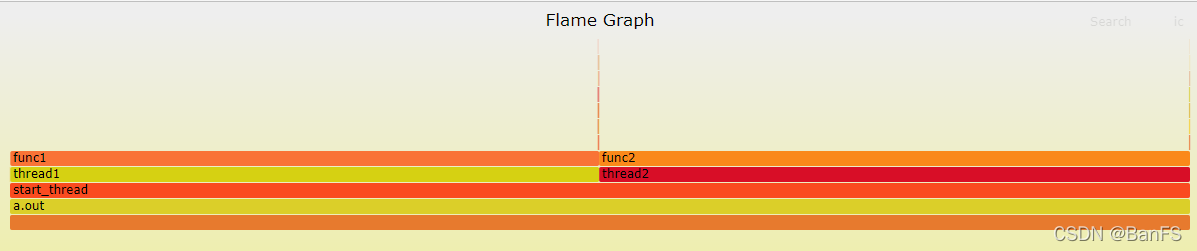
参考资料:
perf Examples
perf性能分析
性能分析利器之perf浅析
利用perf剖析Linux应用程序
Linux性能分析工具Perf简介

在项目中,需要用lua脚本操作redis cluster中的多个key,但是非同slot的时候会报错,例如下面test3、test6在同一个node,但是却不是同一个slot。redis使用lua脚本可以这样redis-cli -a xxxxx--eval demo.lua key1 key2 , val1 val2

1
2
3
4
5
6
7
8
9
10
11
12
13
14
15
banfushen@ma100:~/redis-cluster$ redis-cli -p 16380 -c
192.168.88.7:6379> set test3 3333
-> Redirected to slot [13026] located at 192.168.88.3:6379
OK
192.168.88.6:6379> set test5 3333
-> Redirected to slot [4644] located at 192.168.88.5:6379
OK
192.168.88.5:6379> set test6 3333
-> Redirected to slot [8775] located at 192.168.88.3:6379
OK
192.168.88.3:6379> cluster keyslot test3
(integer) 13026
192.168.88.3:6379> cluster keyslot test6
(integer) 8775
192.168.88.3:6379>

通过key传入

一般在redis cluster中使用lua脚本,会碰到(error) CROSSSLOT Keys in request don't hash to the same slot

1
2
3
4
5
6
7
8
9
10
banfushen@ma100:~/test$ cat get.lua
local key1 = KEYS[1]
local key1 = KEYS[2]

local value1 = redis.call("GET", key1)
local value2 = redis.call("GET", key2)

return {value1, value2}
banfushen@ma100:~/test$ redis-cli -p 16380 -c --eval get.lua test3 test6
(error) CROSSSLOT Keys in request don't hash to the same slot

通过value传入

在官方的说明中,redis 使用lua脚本是限制在用一个node上使用的,可是这里明明是同一个node,却无法使用,但是如果我们把脚本改成下面这样

1
2
3
4
5
6
7
8
9
10
11
banfushen@ma100:~/test$ cat get.lua
local key1 = ARGV[1]
local key2 = ARGV[2]

local value1 = redis.call("GET", key1)
local value2 = redis.call("GET", key2)

return {value1, value2}
banfushen@ma100:~/test$ redis-cli -p 16380 -c --eval get.lua , test6 test3
1) "3333"
2) "3333"

这样即可解决。

总结

应该是按照KEY传入的时候,redis为了防止key不在同一个node上,对key进行slot判断,如果不是同一个slot就直接返回了,但是是支持同一个node的,只要我们对我们需要操作的key进行分类,同一个node的key通过value传入,即可在lua脚本中对同一个node的key操作。在我们设计redis cluster的时候,是知道每个node的slot的,每个key的solt可以使用以下计算

1
2
192.168.88.3:6379> cluster keyslot test3
(integer) 13026

我们只需要先判断slot在某个范围内,属于一个node,即可进行批量操作。

perf可以针对进程进行profile,也可以对线程进行profile。再对进程profile之后,拿到perf.data,也可以修改为针对进程下的线程进行profile。所以照理来说应该是可以从perf.data中查看到有多少线程。
这也符合我们的一般要求,即有perf.data之后,可以针对线程显示火焰图。经过查询资料发现,perf中有perf data convert --force --to-json temp.json可以把perf.data转成json进行查看,但是要新版本的perf才有…这就恨坑爹,以为着我们需要自己安装最新的perf。

安装perf

我的系统是RedHat系列,对应的Debian系列需要自己修改一下install相关。
拉取最新的内核代码git clone git://git.kernel.org/pub/scm/linux/kernel/git/torvalds/linux.git --depth 1000

1
2
3
4
5
6
7
8
9
10
11
12
13
14
15
16
17
18
19
20
21
22
23
24
25
26
27
28
29
30
31
[root@ip-10-155-128-114 ~]# cd linux/tools/perf/
[root@ip-10-155-128-114 perf]# LIBBABELTRACE=1 LIBBABELTRACE_DIR=/usr/local make
BUILD: Doing 'make -j2' parallel build
HOSTCC fixdep.o
HOSTLD fixdep-in.o
LINK fixdep
Warning: Kernel ABI header at 'tools/include/uapi/linux/kvm.h' differs from latest version at 'include/uapi/linux/kvm.h'
diff -u tools/include/uapi/linux/kvm.h include/uapi/linux/kvm.h
Warning: Kernel ABI header at 'tools/include/uapi/linux/perf_event.h' differs from latest version at 'include/uapi/linux/perf_event.h'
diff -u tools/include/uapi/linux/perf_event.h include/uapi/linux/perf_event.h
Warning: Kernel ABI header at 'tools/include/uapi/linux/prctl.h' differs from latest version at 'include/uapi/linux/prctl.h'
diff -u tools/include/uapi/linux/prctl.h include/uapi/linux/prctl.h
Warning: Kernel ABI header at 'tools/include/uapi/sound/asound.h' differs from latest version at 'include/uapi/sound/asound.h'
diff -u tools/include/uapi/sound/asound.h include/uapi/sound/asound.h
Warning: Kernel ABI header at 'tools/arch/x86/include/asm/cpufeatures.h' differs from latest version at 'arch/x86/include/asm/cpufeatures.h'
diff -u tools/arch/x86/include/asm/cpufeatures.h arch/x86/include/asm/cpufeatures.h
Warning: Kernel ABI header at 'tools/arch/x86/include/uapi/asm/prctl.h' differs from latest version at 'arch/x86/include/uapi/asm/prctl.h'
diff -u tools/arch/x86/include/uapi/asm/prctl.h arch/x86/include/uapi/asm/prctl.h
Warning: Kernel ABI header at 'tools/include/uapi/asm-generic/unistd.h' differs from latest version at 'include/uapi/asm-generic/unistd.h'
diff -u tools/include/uapi/asm-generic/unistd.h include/uapi/asm-generic/unistd.h
Warning: Kernel ABI header at 'tools/perf/arch/x86/entry/syscalls/syscall_64.tbl' differs from latest version at 'arch/x86/entry/syscalls/syscall_64.tbl'
diff -u tools/perf/arch/x86/entry/syscalls/syscall_64.tbl arch/x86/entry/syscalls/syscall_64.tbl
Warning: Kernel ABI header at 'tools/perf/arch/powerpc/entry/syscalls/syscall.tbl' differs from latest version at 'arch/powerpc/kernel/syscalls/syscall.tbl'
diff -u tools/perf/arch/powerpc/entry/syscalls/syscall.tbl arch/powerpc/kernel/syscalls/syscall.tbl
Warning: Kernel ABI header at 'tools/perf/arch/s390/entry/syscalls/syscall.tbl' differs from latest version at 'arch/s390/kernel/syscalls/syscall.tbl'
diff -u tools/perf/arch/s390/entry/syscalls/syscall.tbl arch/s390/kernel/syscalls/syscall.tbl
Warning: Kernel ABI header at 'tools/perf/arch/mips/entry/syscalls/syscall_n64.tbl' differs from latest version at 'arch/mips/kernel/syscalls/syscall_n64.tbl'
diff -u tools/perf/arch/mips/entry/syscalls/syscall_n64.tbl arch/mips/kernel/syscalls/syscall_n64.tbl
Makefile.config:201: *** Error: flex is missing on this system, please install it. Stop.
make[1]: *** [sub-make] Error 2
make: *** [all] Error 2

错误原因是没有flex,安装flex,yum install flex,安装flex之后还需要安装bison,yum install bison,安装完毕后重新LIBBABELTRACE=1 LIBBABELTRACE_DIR=/usr/local make即可,前面加环境变量是因为需要在这个环境变量下编译才能使用perf data做转换。否则会报错perf should be compiled with environment variables LIBBABELTRACE=1 and LIBBA。
之后便可以用perf data将采集到的数据转成json,这样就可以看到进程中有哪些线程,可以针对单线程做profile。

1
2
[root@ip-10-155-136-104 ~]# ./linux/tools/perf/perf record -g -F 99 -p 3169  ## 3169是进程id
[root@ip-10-155-136-104 ~]# ./linux/tools/perf/perf data convert --force --to-json temp.json

最后在写个脚本分析json文件即可。
参考:
perf.data转成json
perf file format
perf.data-file-format.txt

项目集群是使用k8s管理的,流量分发使用的是iptable,据压测反馈说负载不均衡,吓得老夫赶紧去查看,发现原来是压测同学搞错了。在查询的过程中,发现iptable规则之后的probability越来越大,记录一下原因。

1
2
3
4
5
6
7
8
9
10
root@ip-10-1-34-89:/home/admin# iptables -t nat -nL
...
Chain KUBE-SVC-7XZINH2IMK6FHKPK (2 references)
target prot opt source destination
KUBE-SEP-TOX5PBICM2IS3QEP all -- 0.0.0.0/0 0.0.0.0/0 statistic mode random probability 0.20000000019
KUBE-SEP-BHWNMZ5XNYG7AESG all -- 0.0.0.0/0 0.0.0.0/0 statistic mode random probability 0.25000000000
KUBE-SEP-OQLKQS2OMOJTYZF6 all -- 0.0.0.0/0 0.0.0.0/0 statistic mode random probability 0.33332999982
KUBE-SEP-EQOKMESPFMECIZJJ all -- 0.0.0.0/0 0.0.0.0/0 statistic mode random probability 0.50000000000
KUBE-SEP-GVLV4E5D2AGR4O5J all -- 0.0.0.0/0 0.0.0.0/0
...

可以看到,总共5条记录,刚开始probability为0.2—->0.25—->0.33—->0.5—-无,为什么会这样。
因为流量进入之后,按照iptable规则转发,公共5条,所以第一条接收20%的流量。
剩下还有4条,下一条应该接收剩余流量的1/4,也就是25%。
剩下还有3条,下一条应该接收剩余流量的1/3,也就是33%。
……
最后一条因为只剩下它了,所有流量都会走这里,所以不用写probability。