背景知识
Perf是用于软件性能分析的工具,通过Perf,应用程序可以利用PMU,tracepoint和内核中的特殊计数器进行性能统计。Perf不但可以分析应用程序的性能问题(per thread),也可以分析内核的性能问题,处理所有性能相关的事件:程序运行期间的硬件事件,如instructions retired ,processor clock cycles等;软件事件,如Page Fault和进程切换。
Perf基本原理是对被监测对象进行采样,最简单的情形是根据tick中断进行采样,即在tick中断内触发采样点,在采样点里判断程序当前的上下文。假如一个程序90%的时间都花费在函数func1()上,那么90%的采样点都应该落在函数func1()的上下文中,采样时间越长,上述推论越可靠。使用perf要有管理员权限
使用perf对多线程进行profile
准备多线程程序
在此程序中,创建了两个线程。分别跑了不同次数的func1()方法。gcc -lpthread main.c
1 |
|
使用perf对程序进行采样
对还没启动的程序
1 | root@ma100:/home/banfushen/perf_cpu/multi_thread# perf record -h |
perf record -g -F 99 ./a.out,对多线程程序进行采样,采样频率99,(-F 99: sample at 99 Hertz (samples per second). I’ll sometimes sample faster than this (up to 999 Hertz), but that also costs overhead. 99 Hertz should be negligible. Also, the value ‘99’ and not ‘100’ is to avoid lockstep sampling, which can produce skewed results.)。运行完毕会得到一个perf.data,要想得到火焰图,还需要借助别的工具。
对已经启动的程序
对于已经启动的程序,要拿到pid,perf record -g -F 99 -p <pid>
下载工具FlameGraph
git clone https://github.com/brendangregg/FlameGraph.git
1 | banfushen@ma100:~/perf_cpu/FlameGraph$ pwd |
生成火焰图
对perf.data生成火焰图(按照上面来说就是一个进程的)
perf script |/home/banfushen/perf_cpu/FlameGraph/stackcollapse-perf.pl|/home/banfushen/perf_cpu/FlameGraph/flamegraph.pl > output.svg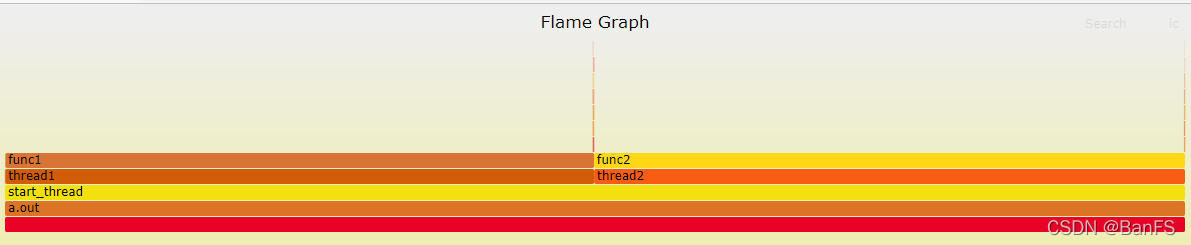
对单个线程生成火焰图
要知道线程id
1 | root@ma100:/home/banfushen/perf_cpu/multi_thread# perf script -h |
perf script -v --tid <tid> 指定线程perf script -v --tid 2283471|/home/banfushen/perf_cpu/FlameGraph/stackcollapse-perf.pl|/home/banfushen/perf_cpu/FlameGraph/flamegraph.pl > output1.svg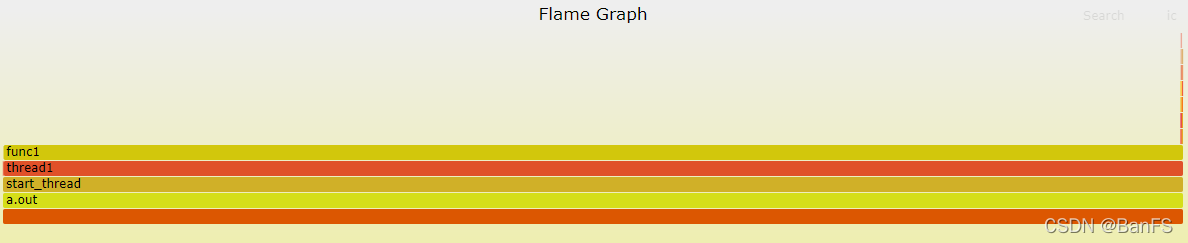
对多个线程生成火焰图
perf script -v --tid <tid[,tid...]> 指定多个线程perf script -v --tid 2283472,2283471|/home/banfushen/perf_cpu/FlameGraph/stackcollapse-perf.pl|/home/banfushen/perf_cpu/FlameGraph/flamegraph.pl > output3.svg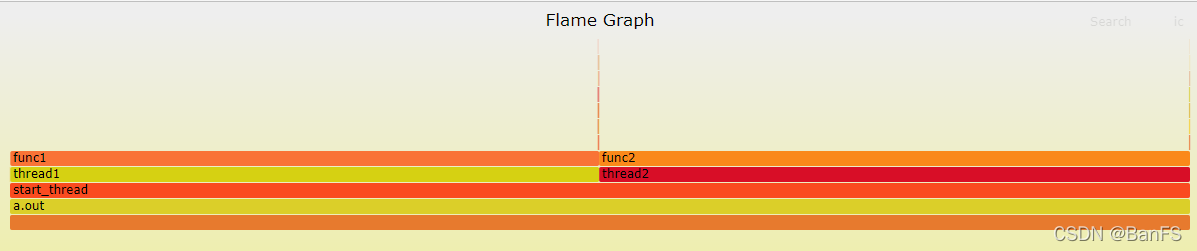
参考资料:
perf Examples
perf性能分析
性能分析利器之perf浅析
利用perf剖析Linux应用程序
Linux性能分析工具Perf简介